Basemap: Colorbar
The Colorbar active dialog displays the colorbar that is being applied to your ribboned data, which may include horizon, grid, mistie, and well information data. The colorbar can be displayed as a histogram, or as a block of color. To turn the Colorbar active dialog on or off, from the View menu on the Basemap, select Active Dialogs, then Colorbar. You can also move, resize, and undock this dialog.

Colorbar Range
The colorbar range is displayed at the top of the active dialog in brackets, preceded by the display method, which will read "User defined", "Automatic", or "Window".Automatic: The colorbar range is determined from the minimum and maximum data values of all of the ribboned data that is being displayed, including data that is outside the current map view.
Window: The colorbar range is determine from the minimum and maximum data values of the ribboned values that are being displayed, and are visible in the current map view.
Colorbar
The name of the colorbar appears below the colorbar range. You can change the colorbar from the colorbar list, found on the Colorbar/Histogrampage in the Color Properties section of General Basemap Properties. You can also access the Colorbar/Histogram page from the Ribbon Properties dialog box, which you can open by selecting Properties from the shortcut menu.Shortcut Menu
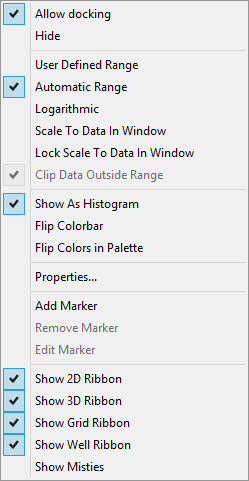
Right click on the colorbar to open the shortcut menu. From here you can access more colorbar options. Most of these are also available in the Color Properties section of General Basemap Properties.
Also See
- Active Dialogs
- Moving, Resizing and Docking Active Dialogs
- View Menu
- Color
Properties: Colorbar/Histogram
- Color Properties: Colorbar Markers
— MORE INFORMATION

|
Copyright © 2020 | SeisWare International Inc. | All rights reserved |